Dem Damn........
Statistics

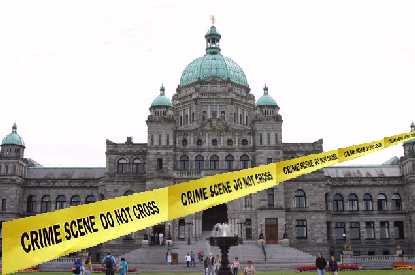
As it rains outside, and I wait for this evening's debate, the only debate available through the air in my part of the Vast Hurtland, I thought I would amuse myself by looking at my traffic patterns of late. As the illustration above, showing the most recent ALMOST twelve weeks illustrates, traffic is on the upswing here at the house. Traffic always increases in a direct ratio to the frequency of posting here. However, this current positive trend I attribute mostly to the recent short Legislative sitting, the BC Rail hub-bub and Kinsella etc. flare-ups lately, but mostly the current election campaign with nine days left till the BIG DAY.
I thought I would share some of my findings and thoughts about this recent data and trends with my readers while we wait for the debate.
I also hope the debate is a bit more satisfying for us BCers than was last night's debacle at GM Place by our Canucks. But hey, I guess we couldn't expect 'em to go 16-0, eh?
Statistics themselves don't Lie
Most people are familiar with that chestnut about, "There are Lies, Damn Lies and then there's Statistics." But statistics are merely data, and they don't really do anything, they only exist to be seen or not seen. You can call the distance from one place to another one mile or one point six kilometres, but it is still the same distance, it is just expressed in different terms, and to walk it will require the same amount of time and energy, however you choose to express/measure those qualities. This is like Shakespeare's "rose by any other name."
Lies and Statistics get so mixed up in people's minds, especially in a society that is generally not interested in or well educated in numeracy and mathematics in general because people who do understand statistics/mathematics use them to confuse, mislead or exploit other people . This works to the advantage of bankers, stock promoters and other casino operators and snake oil salesmen of all varieties who tend to understand the principles of compound interest and probibility very well and profit greatly because of it. Likewise political operatives can use statistics to help them design their campaign - by getting accurate data and interpreting it properly - some folks call this type 'internal polling.' But then they can choose how to share the same data, after massaging it to convey whatever they want it to SEEM to PROVE - this is what the media or the parties put out to affect the public's perception!
Webmasters and bloggers who care to can track their visitors and the data thus collected once organized becomes what IT types usually call 'stats.' In the internal polling sense the web master can then analyze these stats to determine how to decrease, increase or otherwise change who from where comes to visit their site. If you are selling something, even just advertising, then sheer volume may be the goal. On the other hand if you are trying to rid yourself of annoying people, or people who can't afford what you are selling, or live too far away to hire your services, you might want to change your content to more efficiently attract the audience that satisfies the goals of the web-site.
Since I may someday sign up with Google Ads or something - volume is good, and as the illustration above illustrates, traffic is up lately at the House. But as much as I may appreciate a visitor from Burkina Faso, though that visitor could be someone traveling from British Columbia, I value visitors from the "bestest place on earth" the most, since the House is all about BC issues. So today when I decided to analyze my most recent 500 visitors I was extremely pleased with the results because:
1. 96% were from Canada
2. 90% of the total were from British Columbia
3. Approximately forty different communities from
every part of BC supplied those visitors
Considering that some of those communities are large communities, like Victoria, Vancouver and smaller centers and that merely represents where the server is located, it is even more than the forty communities that are named. Nelson alone could represent visitors from Balfour, Kaslo, Slocan, New Denver, Silverton, etc.
Interestingly the single largest number of visits came from Victoria, which considering it is the capital, is quite satisfying, even if as I suspect, we are all paying for half or more of them, being as it is likely they are members of what the Pacific Gazetteer refers to as the PABst Blue/Red Ribbon Brigade. But still, I was surprised to see Victoria sending over 2 1/2 times the visitors as even the Big Smoke itself - Vancouver. I guess if you add in Burnaby and Surrey though, they almost even out.
To see the list of BC Communities who have visited the House most recently just click on the Click for More link as I will tuck the listing below the fold.
More
Visitors – Percent - Community
115 - 23.00% Victoria
49 - 9.80% Vancouver
39 - 7.80% Burnaby
34 - 6.80% Surrey
22 - 4.40% Abbotsford
16 - 3.20% Coquitlam
15 - 3.00% Prince George
15 - 3.00% Langley
14 - 2.80% Campbell River
13 - 2.60% One Hundred Mile House
12 - 2.40% Delta
12 - 2.40% Qualicum Beach
11 - 2.20% Kelowna
10 - 2.00% Kamloops
9 - 1.80% Maple Ridge
9 - 1.80% Duncan
8 - 1.60% Cobble Hill
8 - 1.60% Nanaimo
7 - 1.40% North Vancouver
4 - 0.80% Port Alberni
4 - 0.80% Cranbrook
2 - 0.40% Courtenay
2 - 0.40% Grand Forks
2 -0.40% Powell River
2 - 0.40% Port Coquitlam
2 - 0.40% Fort Saint John
2 - 0.40% Nelson
2 - 0.40% Terrace
2 - 0.40% Chilliwack
2 - 0.40% Richmond
1 - 0.20% Salmo
1 - 0.20% Ganges
1 - 0.20% Bella Coola
1 - 0.20% Kitimat
1 - 0.20% New Westminster
1 - 0.20% Parksville
posted by kootcoot at 9:22 AM
![]()
![]()


1 Comments:
Wow Koot 2.6% from 100 Mile House. I didn't think I visited that much.
Partly on the subject. I loat my old counter somehow and when I went to install the one you mentioned I had problems. Look for an e-mail soon.
Post a Comment
<< Home